
State Bank of India (SBI) posts record ₹21,028 Cr profit in Q3 FY26, driving Nifty Bank higher. Explore SBI’s financial highlights, technical entry points, brokerage targets, and investment outlook.
SBI Q3 FY26: Blockbuster Earnings Drive Market Sentiment
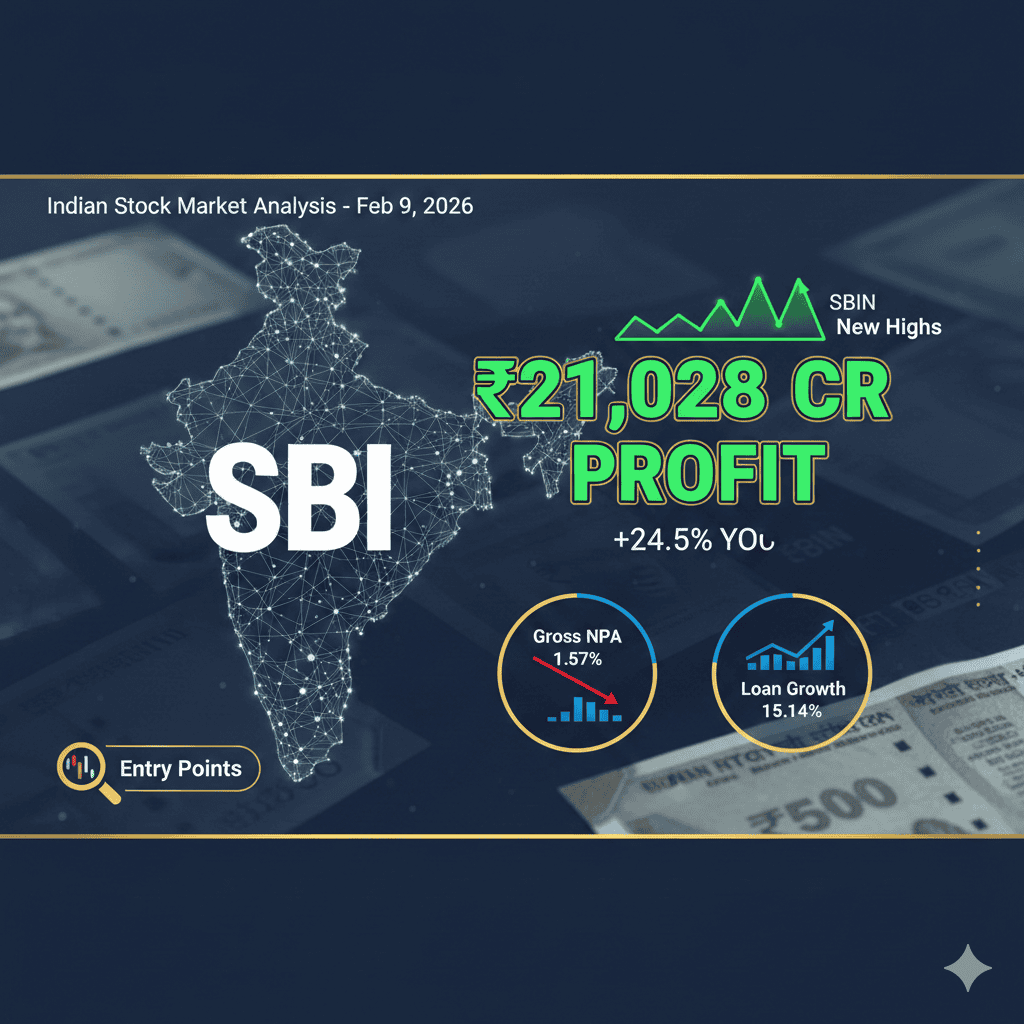
State Bank of India (SBIN) reaffirmed its leadership in the Indian banking space with a 24.5% YoY surge in standalone net profit, reaching a record ₹21,028 crore. The results, announced on February 7, 2026, triggered a sharp rally in SBI’s stock, lifting the entire Nifty Bank index.
🔍 Key Financial Metrics
| Metric | Q3 FY26 Value | YoY Change | Analyst View |
|---|---|---|---|
| Net Profit (Standalone) | ₹21,028 Cr | +24.5% | Significant Beat |
| Net Interest Income | ₹45,190 Cr | +9.0% | Stable |
| Operating Profit | ₹32,862 Cr | +39.5% | Strong Leverage |
| Gross NPA Ratio | 1.57% | -50 bps | 2-Decade Low |
| Net NPA Ratio | 0.39% | -14 bps | Exceptional |
| Loan Growth | 15.14% | +177 bps | Robust |
🧠 What’s Driving SBI’s Outperformance?
- Asset Quality Breakthrough: GNPA at 1.57% is the lowest in 20 years, reducing credit costs to just 0.29%.
- YONO Dividend Boost: A one-time ₹2,200 Cr dividend from SBI Mutual Fund (ahead of its IPO) lifted non-interest income.
- Corporate Lending Revival: Corporate credit grew 13.4% YoY, signaling a rebound in private capex.
📈 SBI Technical Analysis: Smart Entry Points
As of Feb 9, 2026, SBI surged 7% intraday, hitting a high of ₹1,136.85. While momentum is strong, strategic entries are key.
Entry Strategies
| Strategy Type | Entry Zone | Target Range | Risk Level |
|---|---|---|---|
| Aggressive Entry | ₹1,120+ (sustained) | ₹1,180–₹1,200 | High (Momentum) |
| Conservative Entry | ₹1,080–₹1,100 | ₹1,150+ | Moderate |
| Long-Term Accumulation | ₹1,050 (20 EMA) | ₹1,300+ (FY27) | Low (Investor) |
📊 Brokerage Targets & Ratings
| Brokerage | Target Price | Rating |
|---|---|---|
| Jefferies | ₹1,300 | Buy |
| Motilal Oswal | ₹1,300 | Buy |
| Nomura | ₹1,235 | Buy |
| JP Morgan | ₹1,250 | Overweight |
🧮 Valuation & Investment Outlook
SBI trades at a P/B ratio of 1.5x–1.6x FY27 estimates, justified by:
- RoE: ~20%
- RoA: >1%
- Loan Growth Guidance: Revised upward to 13%–15%
- SBI Mutual Fund IPO: Expected to unlock further shareholder value
Key Technical Levels
- Support Zones: ₹1,100 | ₹1,065
- Resistance Zones: ₹1,150 | ₹1,210
FAQs
- Why did SBI stock rally after Q3 results? SBI posted a record ₹21,028 Cr profit, beating estimates and improving asset quality.
- Is SBI a good buy at current levels? Momentum traders may enter above ₹1,120; long-term investors can accumulate near ₹1,050.
- What is SBI’s loan growth outlook? SBI revised its loan growth guidance to 13%–15%, reflecting strong domestic demand.
- How does SBI’s asset quality compare historically? GNPA at 1.57% is the best in two decades, indicating a clean balance sheet.
- What’s the impact of SBI Mutual Fund’s dividend? The ₹2,200 Cr dividend boosted non-interest income and signals IPO readiness.
⚠️ Disclaimer: This report is for educational purposes only. It does not constitute investment advice. Please consult a SEBI-registered financial advisor before making investment decisions.